Graphs
In discrete mathematics and computer science, graphs are mathematical structures that model relationships between things. When you think about graphs, you might think of things like plots or charts that represent data or you might think about graphs of functions from algebra or calculus. Neither of these are the kinds of graphs we'll be discussing.
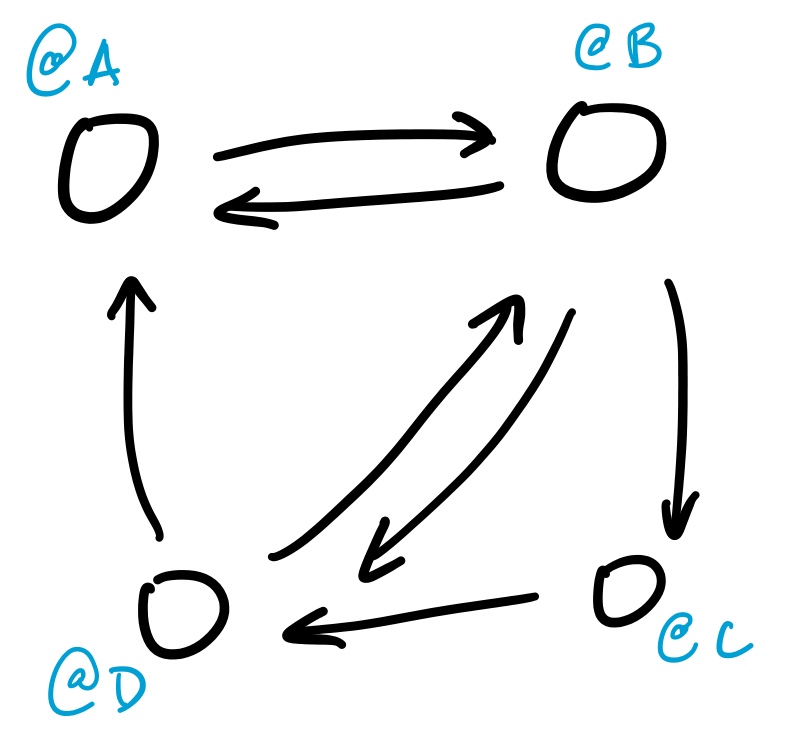
Graphs have a natural visual representation: we represent things as circles, which we call nodes or vertices, and we represent a relationship between two things by drawing a line or arrow between them, which we call edges.
Perhaps some of the most obvious graphs in our lives nowadays are those related to the Internet:
A social network is a graph, where the vertices are people or accounts and the edges are some kind of relationship (friends, followers, etc.). When given this structure, we might want to locate large friend groups and influencers, by looking for cliques, or computing nodes with high centrality.
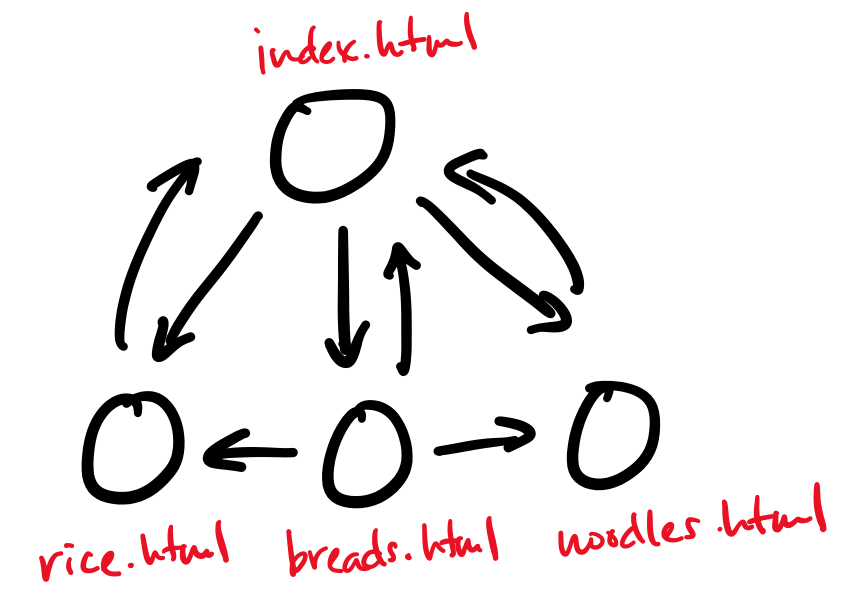
The web is a graph, where the vertices are webpages and the edges are links from one page to another. This model of the web is what informs many web search algorithms, like Google's PageRank, which measures the importance of a webpage based on how many incoming and outgoing links it has.
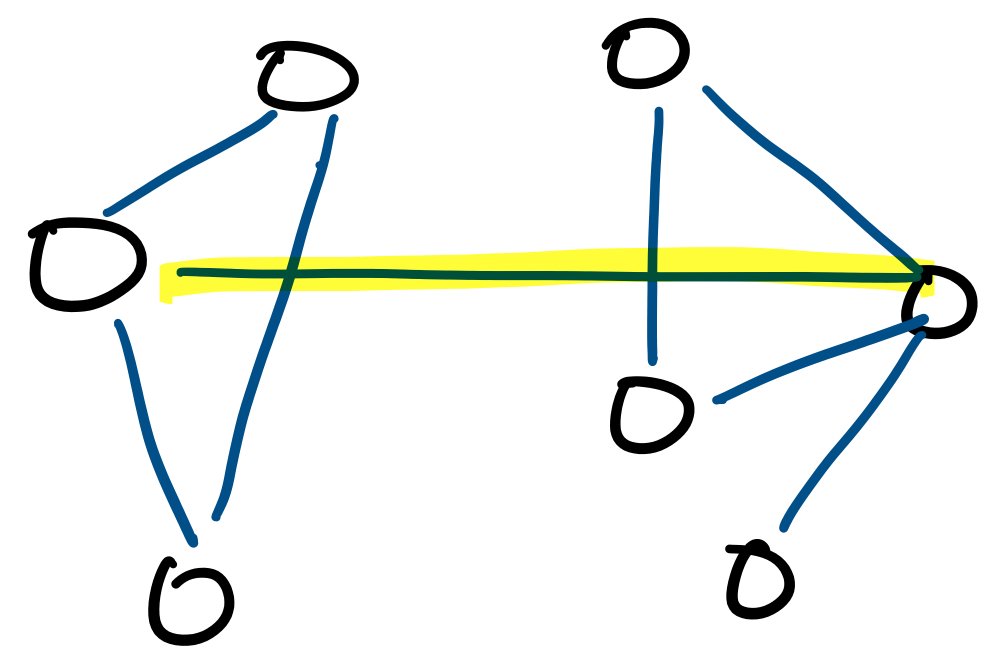
The Internet itself is a graph, where the vertices are the physical computers and the edges are the physical connections between them. Many computer networks can be viewed in this way. A common question that one can ask from this perspective is about minimum cuts. This is the question of what the cheapest way to disconnect the graph is, and therefore sever the network. This is a measure of the robustness of a network.
Graphs also have lots of non-network applications in computer science.
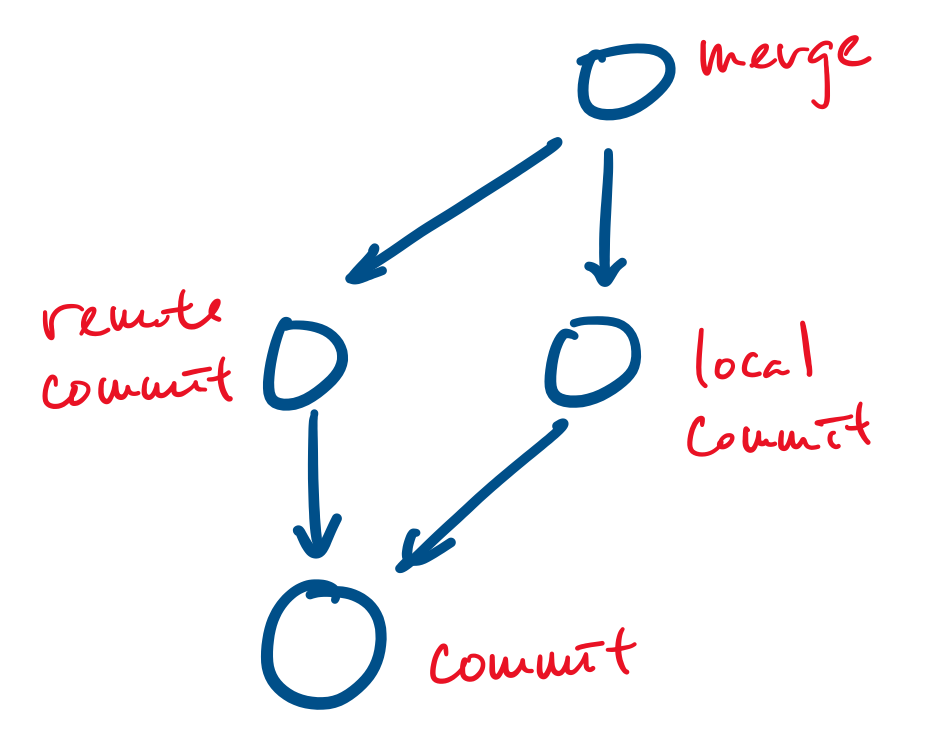
Your favourite revision control system, git, uses a graph based data model: all objects (such as files and commits) are represented as vertices and edges point from an object to an object that they depend on. For example, a commit is represented as a vertex and a merge can be represented as a vertex that points to the commits it merges.
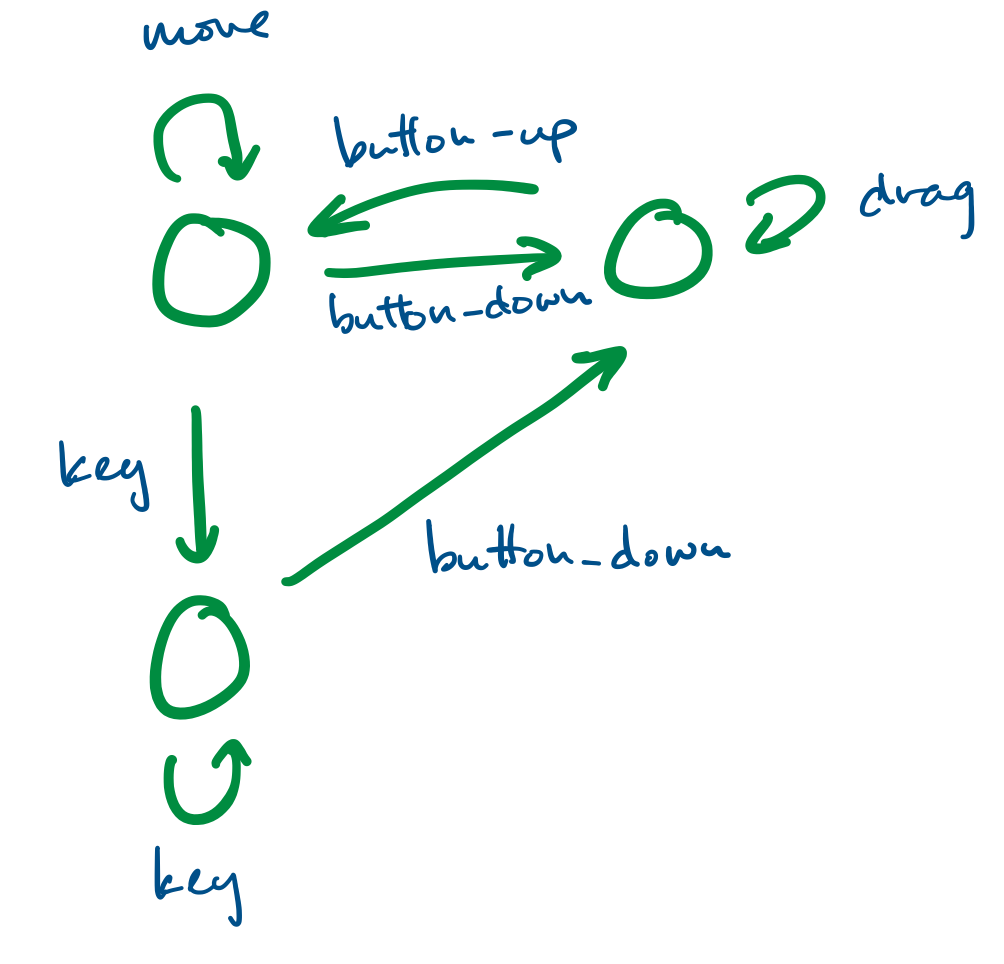
Finite state systems are often represented as graphs. These model the behaviour of complex systems, like software. For example, we can imagine that a program is in a "wait" state until a certain button has been pressed, at which point it moves to the appropriate state.
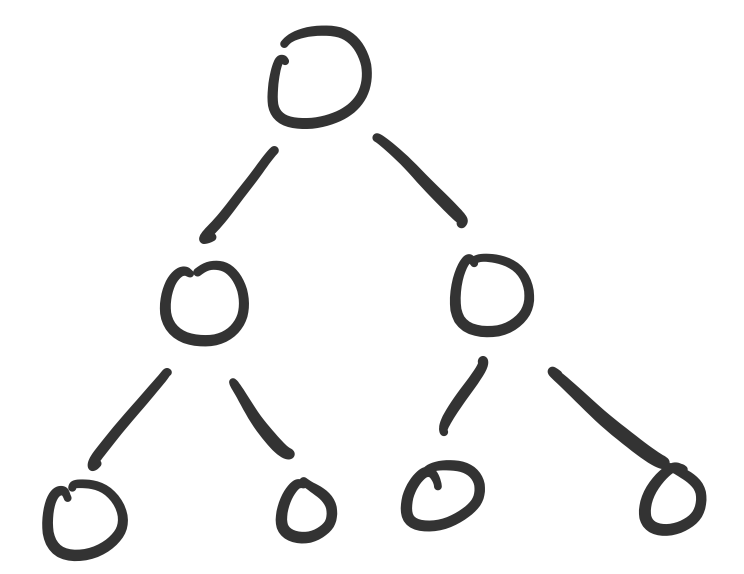
We've already made heavy use of a specific kind of graph: the binary tree. Trees, in general, are a class of graphs, specifically those that do not contain any cycles.
Graphs also model many real-world phenomena.
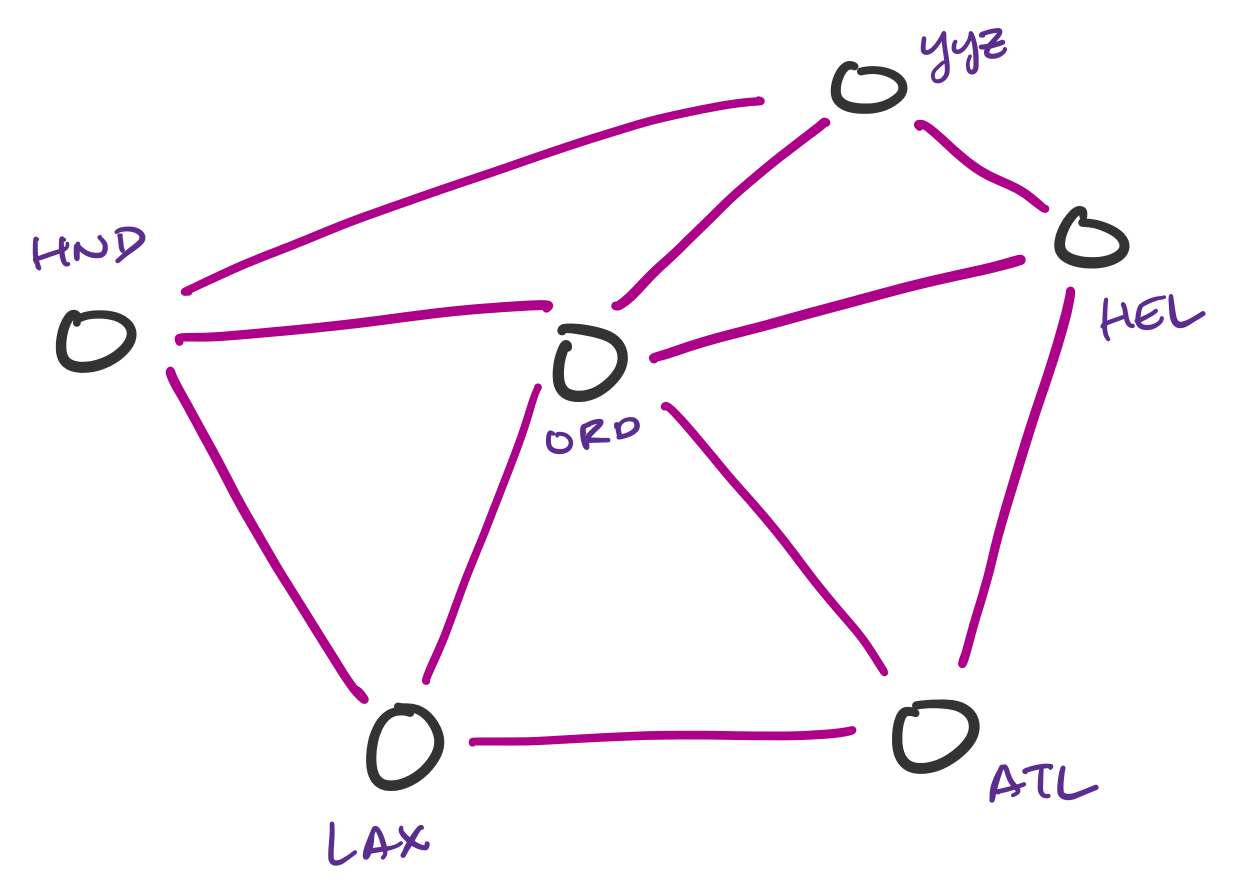
Transportation networks are commonly represented as graphs. These are not necessarily physical traffic networks, but more conceptual ones, like a flight network or a public transit network. One can then ask questions about the lowest-cost path from one node in the network to another.
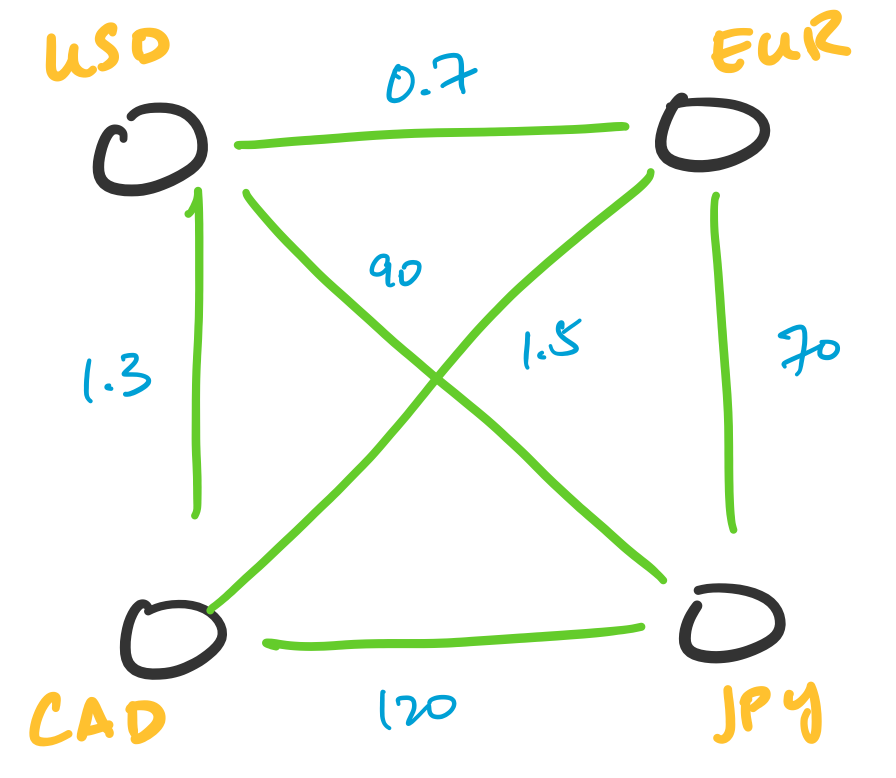
Transactions can be represented as graphs. One particularly interesting application of this is in currency arbitrage. In this setting, we represent currencies as vertices and assign weights to the edges corresponding to the exchange rate between two currencies. What makes this interesting is the fact that exchange rates can be totally independent of each other, which leads to opportunities for arbitrage. This involves indentifying cycles of a particular weight.
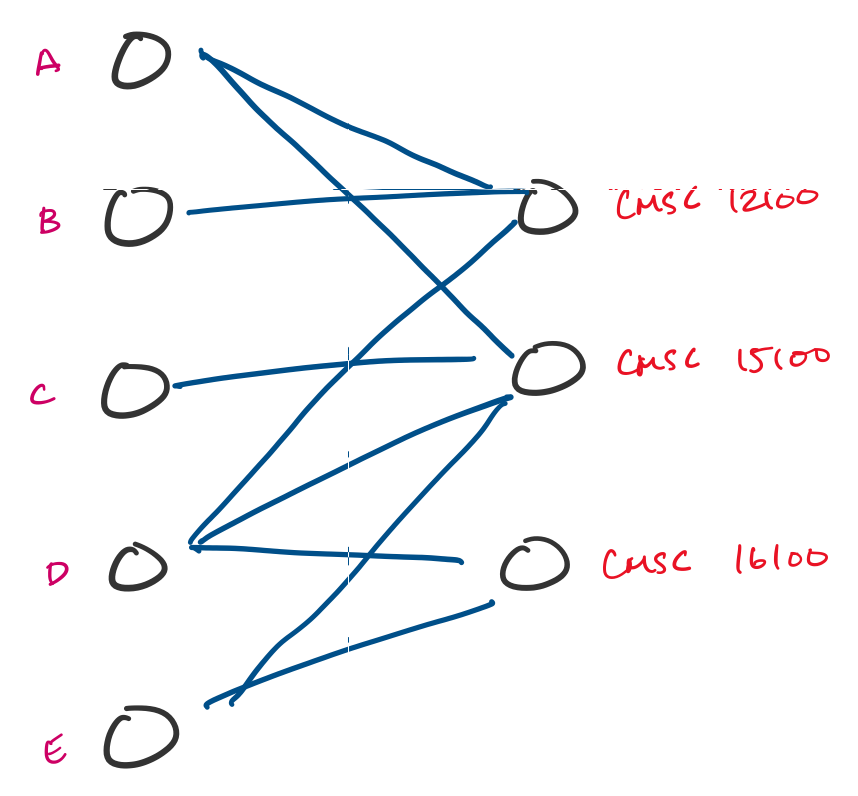
Many tasks can be reformulated as graphs. For instance, resource allocation is something that doesn't look like a graph problem, but can be turned into one. Suppose a university is trying to enroll students into classes in an upcoming quarter and students submit preferences for classes they would like to take. This can be modeled using a graph, and a possible assignment is a choice of a subset of edges.
Formally, a graph is a pair $G = (V,E)$ of a non-empty set of vertices $V$ and a set of edges $E$. An edge is a pair $(u,v)$ of vertices $u,v \in V$. An edge $(u,v)$ is interpreted as an edge from $u$ to $v$ only and $(u,v) \neq (v,u)$.
As we've seen already, we typically represent vertices or nodes as circles with labels and we represent edges with arrows. One common pitfall is confusing the graph with its visual representation. The visual representation of a graph is primarily for our convenience.
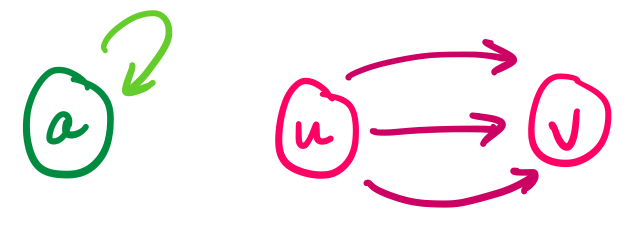
In the simplest definitions, we forbid edges from joining the same vertex (i.e. there are no edges $(v,v)$) and more than one edge from joining two vertices in the same direction (i.e. there can be at most one edge $(u,v)$).
So how do we represent a graph in Racket? Since a graph is really just two sets, we could simply store the vertices and edges each in their own list and call it a day. But if we put a bit more thought into it, we can design a more helpful structure.
The first observation we make is that each edge is associated with two vertices, so it makes sense to tie these two pieces of information together. We will the edges of a graph based on the source vertex. That is, if $(u,v)$ is an edge, we will store it with the vertex $u$.
Since a vertex can have multiple edges leaving it, it makes sense to store this information as a list. Furthermore, since there can only be one edge between any pair of vertices, we can represent the edge in this representation by labeling it with the destination vertex. This is called an adjacency list, or the edge-list representation of a graph.
This leads to the following structure and types for graphs.
(define-type Graph (Listof Vertex))
(define-struct Vertex
  ([label : Symbol]
   [neighbours : (Listof Symbol)]))
Here, a graph is just a list of vertices. Vertices are represented by a Vertex structure, that include a label and a list of its neighbours, or those vertices that are joined by an edge to the vertex. Note that neighbours is a list of the labels of vertices, not the vertices themselves.
Consider the following graph.
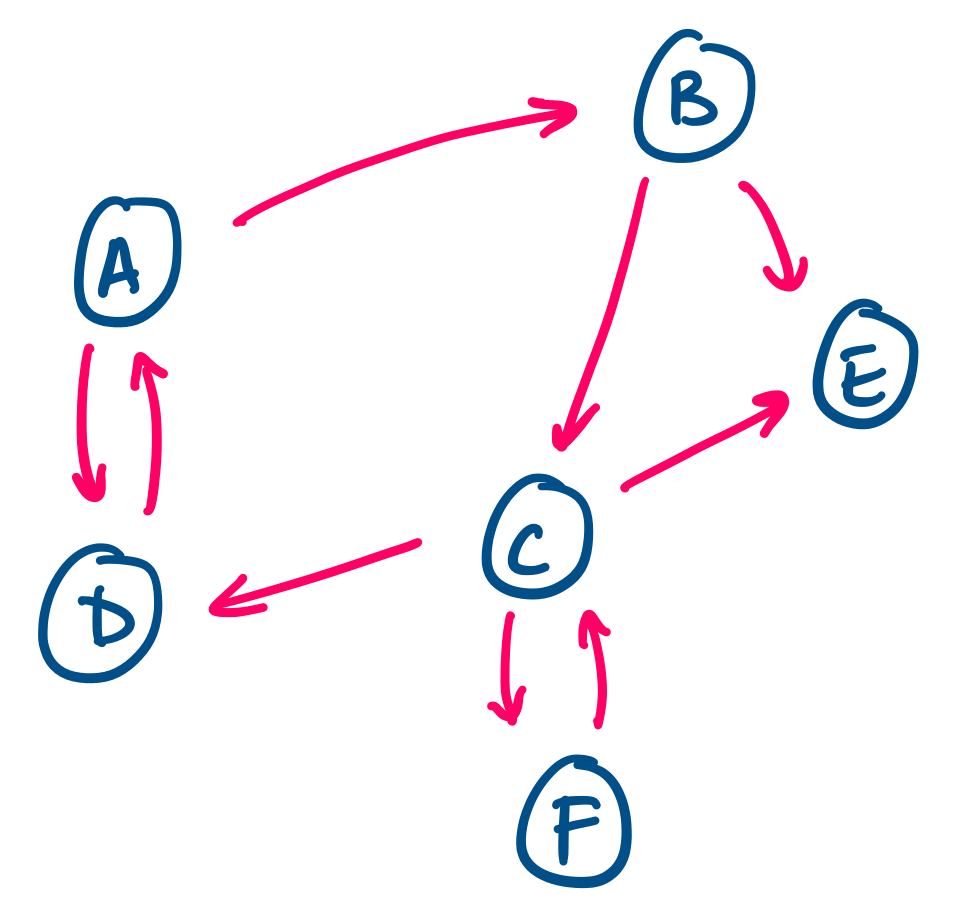
This graph has a vertex set $\{A,B,C,D,E,F\}$ and edge set
\[\{(A,B), (A,D), (B,C), (B,E), (C,D), (C,E), (C,F), (D,A), (F,C)\}.\]
Then we define the following graph by
(list (Vertex 'A '(B D))
      (Vertex 'B '(C E))
      (Vertex 'C '(D E F))
      (Vertex 'D '(A))
      (Vertex 'E '())
      (Vertex 'F '(C))))
Note that this is one possible representation for graphs. We can come up with some other representation depending on our needs.
What can we glean from this graph? An important thing we would like to know about a graph is computing the neighbourhood of a given vertex. The adjacency list representation makes this very easy for us.
(: neighbourhood (-> Symbol Graph (Listof Symbol)))
;; Produce a list of the neighbours of a vertex v in a graph g.
(define (neighbourhood v g)
  (match g
    ['() (error (string-append "No vertex in graph: "
                               (symbol->string v)))]
    [(cons (Vertex u ns) tail)
     (if (symbol=? u v)
         ns
         (neighbourhood v tail))]))
This function amounts to searching our graph for the given vertex and producing the list of its neighbours. Notice that we can't simply return the empty list in this case and we must raise an error if the vertex is not in the graph. This is because there may be vertices in the graph that don't have any neighbours.